
Schedule Risk Analysis

Will you hit the date? Know the odds.

Run thousands of Monte Carlo simulations across your schedule to see the real probability of finishing on time — P50, P80, a confidence S-curve, and the activities driving the risk.
app.buildorch.io / schedule-risk
Schedule Risk Analysis — BuildOrch
P50 / P80
completion dates you can actually commit to
Monte Carlo
thousands of runs across the schedule
Tornado
the activities that move the date most
What it does

Replace the single-date promise with the truth.

A deterministic finish date is a guess. Schedule Risk Analysis gives you the distribution behind it.

🎲Monte Carlo engineThousands of runs over your activity uncertainty ranges.
📅P50 / P80 datesThe dates you can stand behind — at 50% and 80% confidence.
📈Confidence S-curveThe full probability curve of completion over time.
🌪️Tornado sensitivityWhich activities swing the finish date the most.
📏Per-activity bandsOptimistic / likely / pessimistic ranges on every activity.
✂️Compression targetsWhere to compress for the biggest gain in confidence.
BuildOrch AI · Monte Carlo

Ask the odds — then claw them back.

Calibrating uncertainty on hundreds of activities by hand is guesswork. The AI sets sensible optimistic / pessimistic bands from each activity's type and history, explains the result in plain English, and tells you exactly where to compress for the biggest P80 gain.
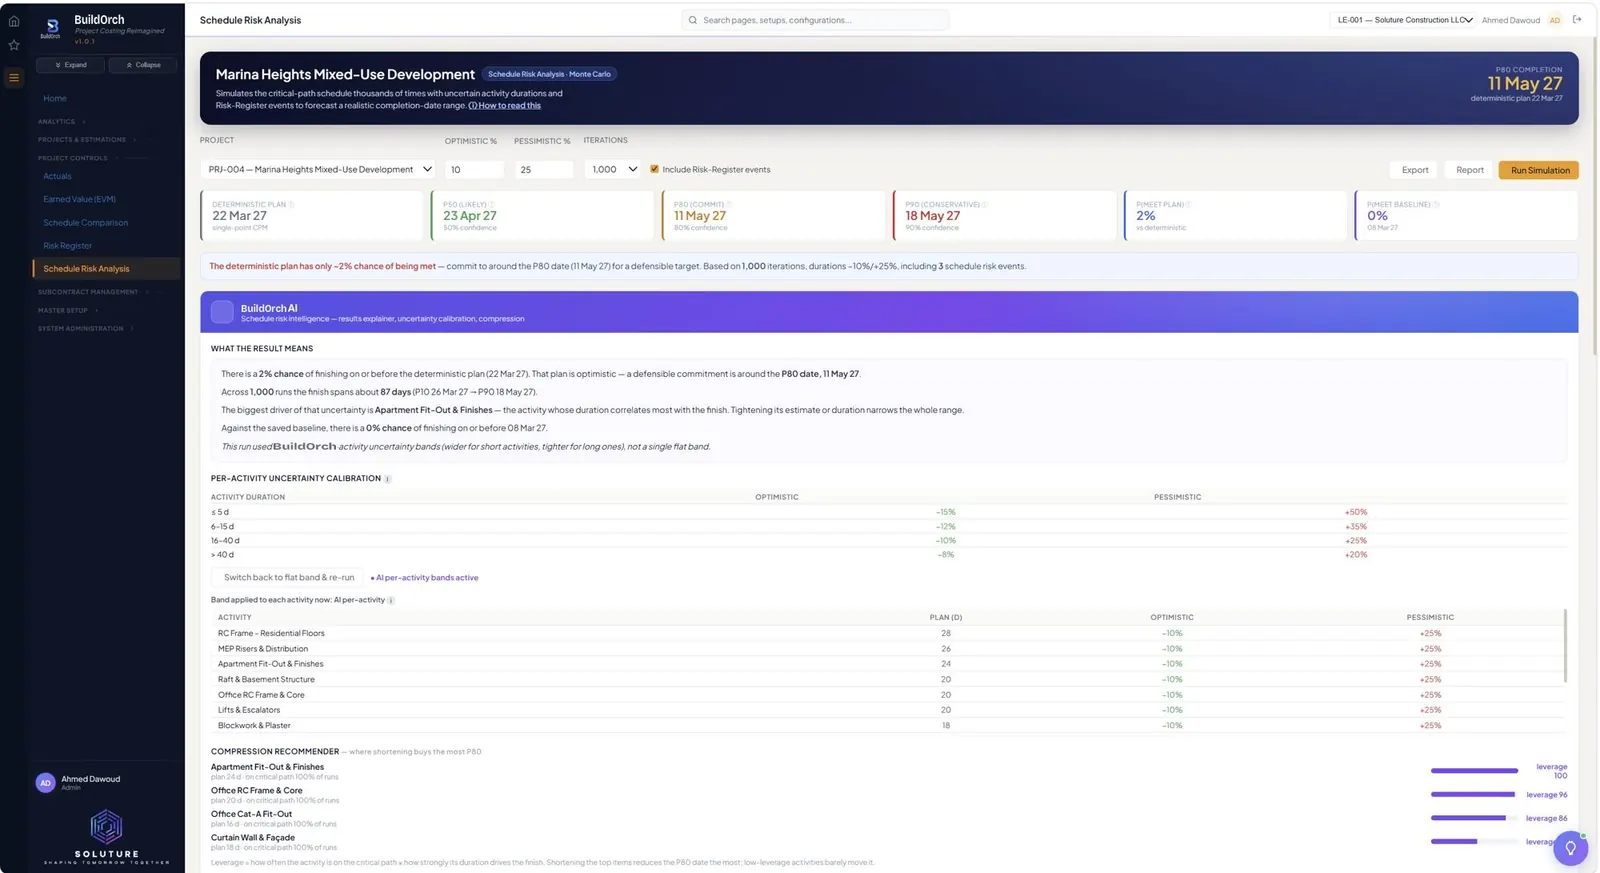
  • Calibrates per-activity uncertainty bands automatically
  • Wider bands for short, volatile activities — tighter where it's known
  • Explains the P50 / P80 result in plain English
  • Recommends the compressions that buy back the most confidence
AI Monte Carlo — uncertainty calibration
Distribution

From a single date to a real probability.

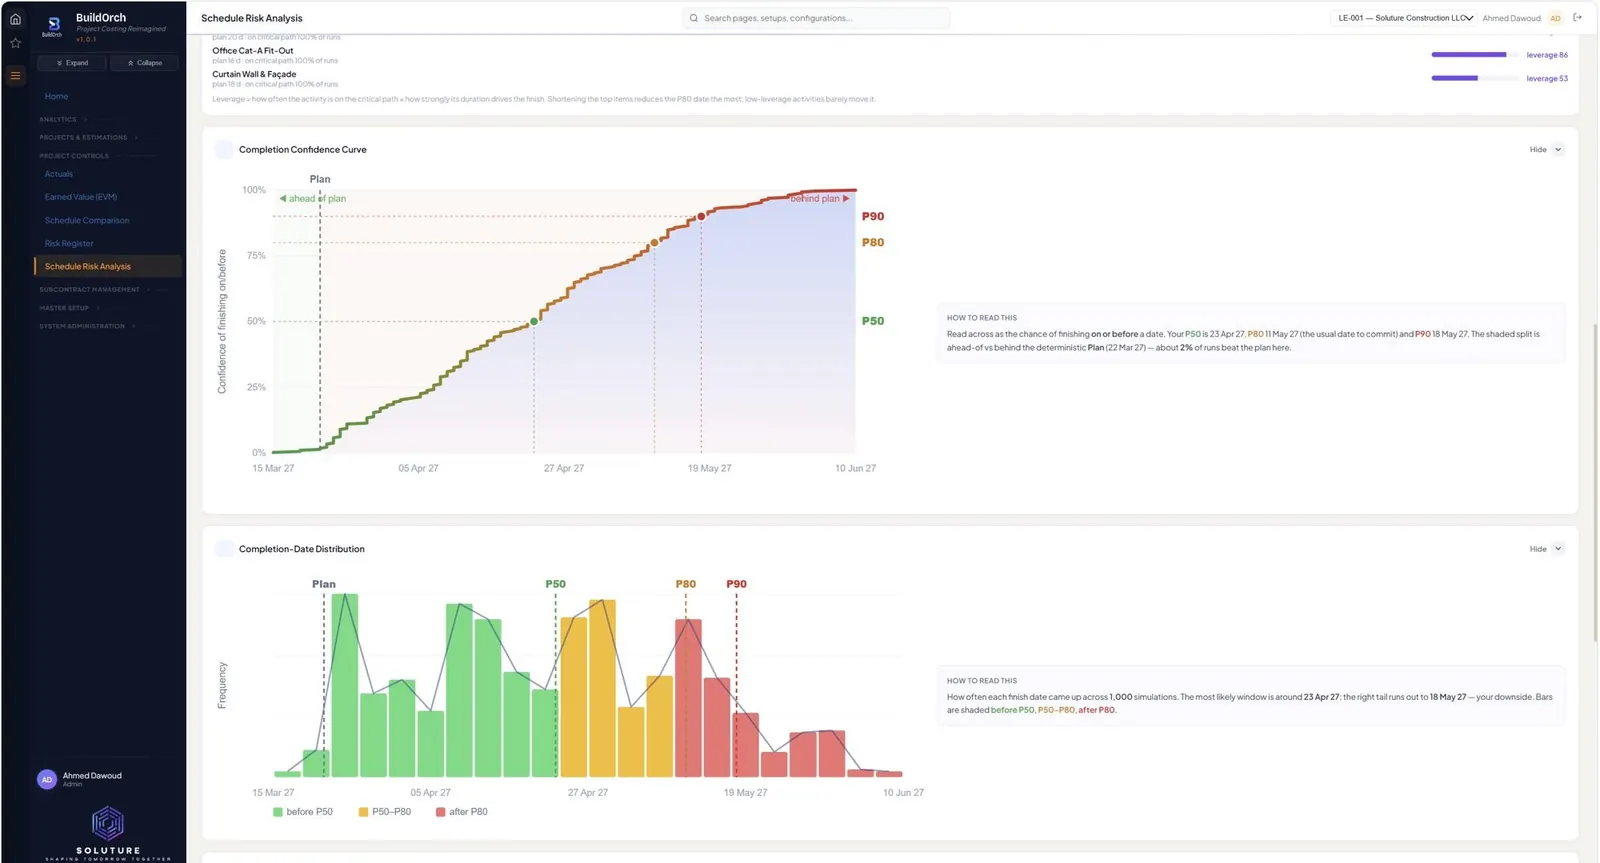
The histogram and confidence S-curve show the full range of likely finish dates — so you commit to P80, not to a hopeful single line that ignores every risk in the plan.

  • Completion histogram across all runs
  • Confidence S-curve with P50 and P80 marked
  • Commit to a date with the risk priced in
  • Re-run as the plan and risks change
Schedule Risk — completion distribution
Sensitivity

Know exactly where the risk lives.

The tornado chart ranks the activities that swing your finish date the most — so mitigation effort goes where it actually changes the odds, not where it feels productive.
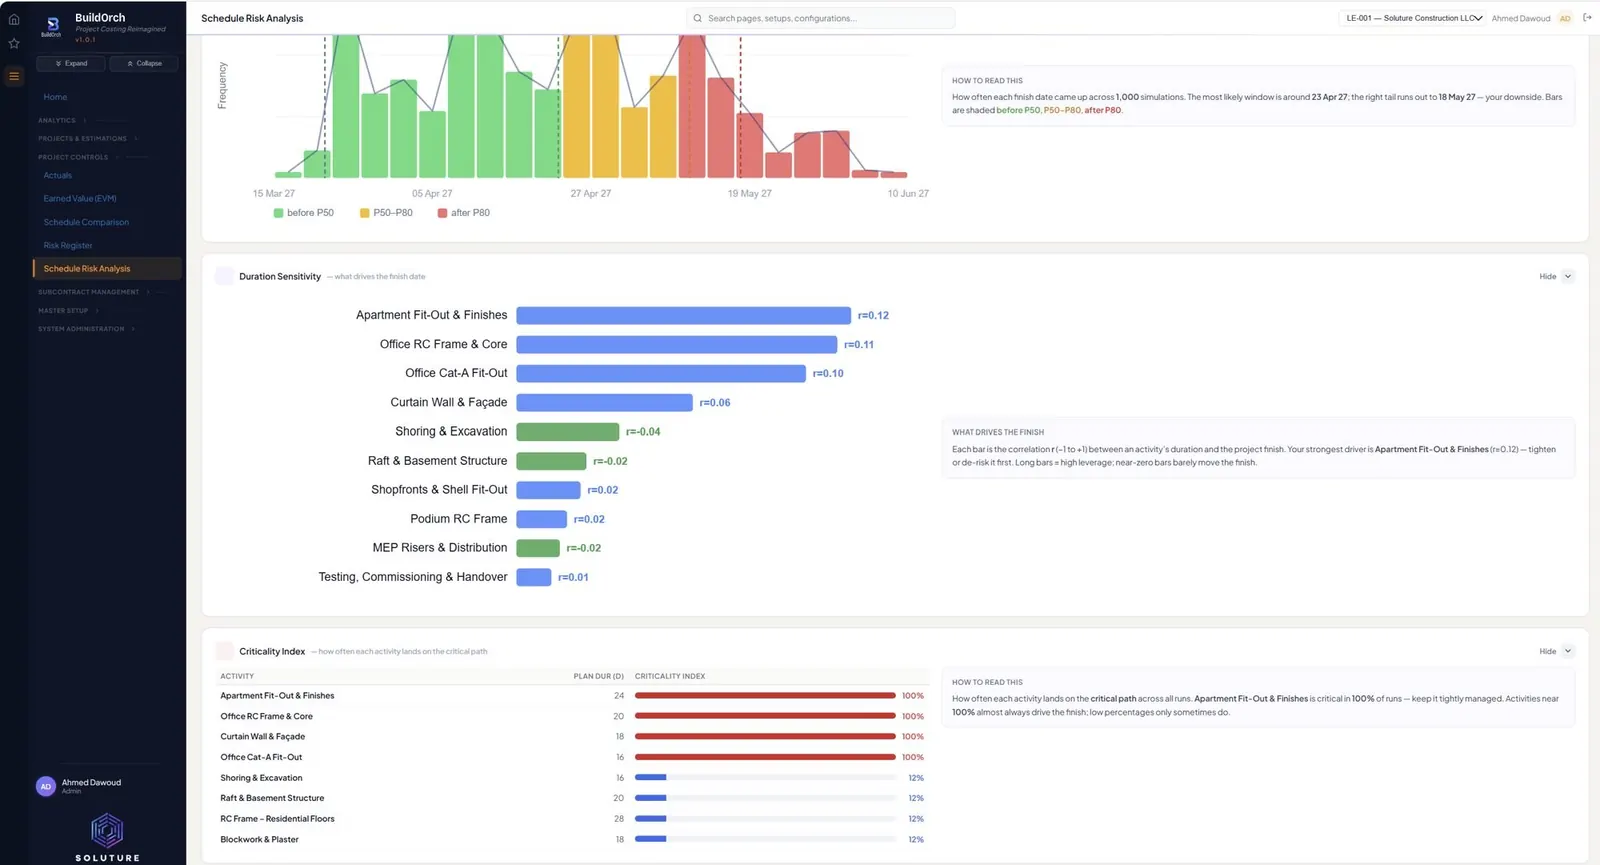
  • Activities ranked by impact on the finish
  • Focus mitigation where it moves the needle
  • Pair with the compression recommender
  • Defensible, data-backed prioritisation
Schedule Risk — tornado sensitivity

Commit to a date you can defend.

We'll run a Monte Carlo analysis on your schedule and show you P80 — and how to protect it.